|
|---|
これは日々の作業を通して学んだことや毎日の生活で気づいたことをを記録しておく備忘録である。
HTML ファイル生成日時: 2026/01/27 23:53:50.919 (台灣標準時)
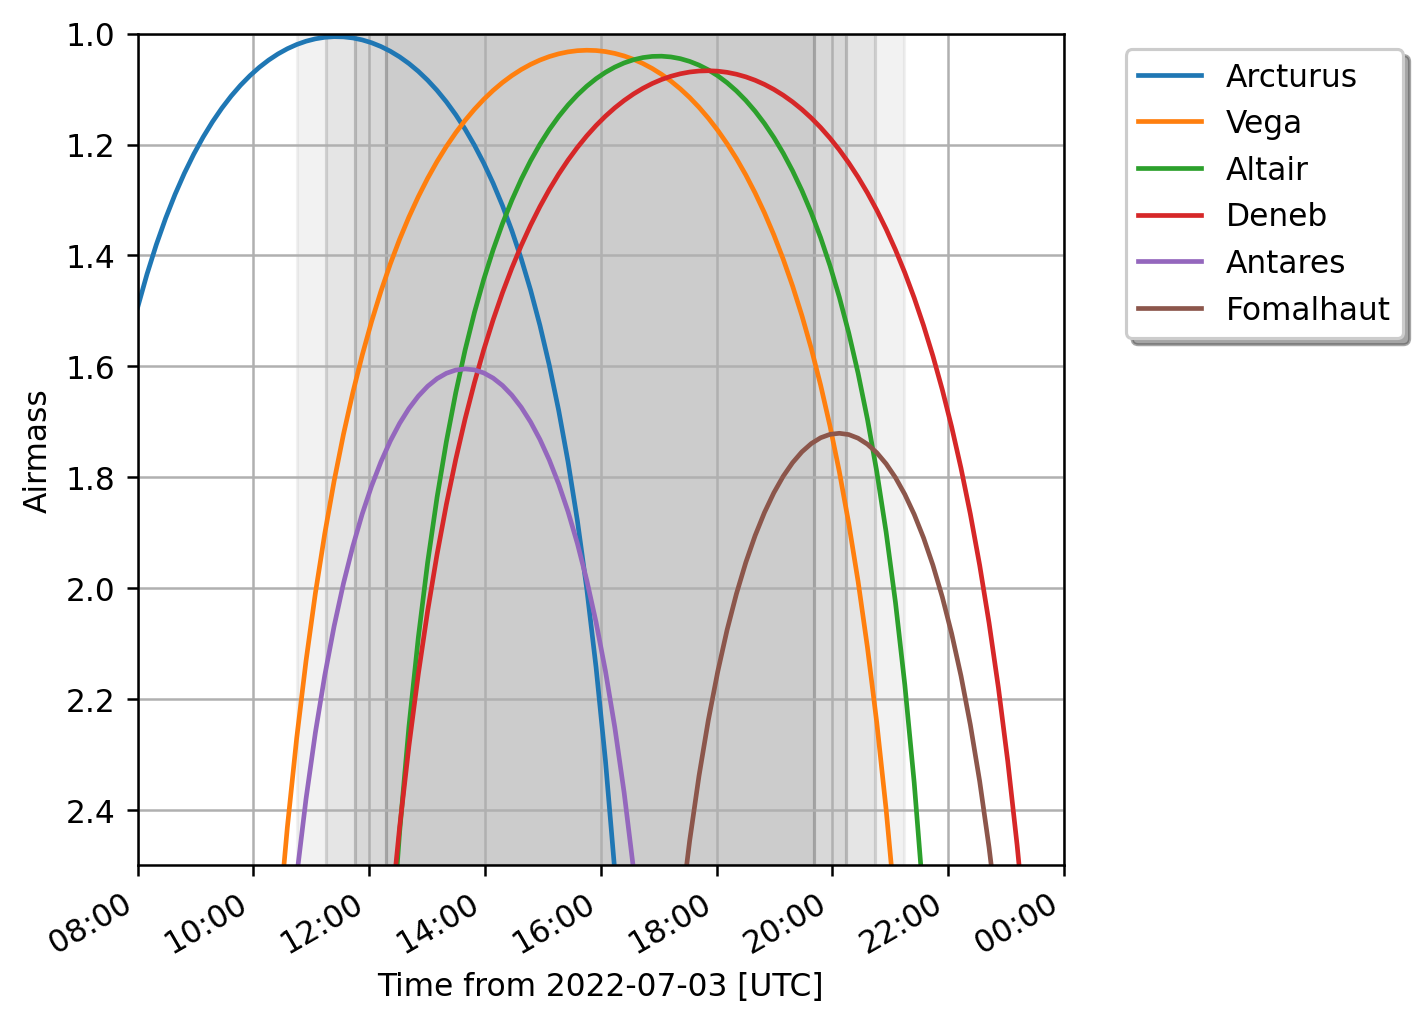
astroplan を使って、与えられた場所と年月日におけるエアマスの変化の図を 作るには以下のようにすればよいようでござる。
#!/usr/pkg/bin/python3.9

#
# Time-stamp: <2022/07/03 12:22:22 (CST) daisuke>
#

# importing argparse module
import argparse

# importing pathlib module
import pathlib

# importing sys module
import sys

# importing numpy module
import numpy

# importing astropy module
import astropy.units
import astropy.time
import astropy.coordinates

# importing astroplan module
import astroplan
import astroplan.plots

# importing matplotlib module
import matplotlib.figure
import matplotlib.backends.backend_agg

# units
unit_m    = astropy.units.m
unit_rad  = astropy.units.rad
unit_deg  = astropy.units.deg
unit_hour = astropy.units.hour

# constructing parser object
desc   = "making an airmass plot"
parser = argparse.ArgumentParser (description=desc)

# adding arguments
parser.add_argument ('-l', '--longitude', default='+121d11m12s', \
                     help='longitude of observing site in format "+121d11m12s"')
parser.add_argument ('-b', '--latitude', default='+24d58m12s', \
                     help='latitude of observing site in format "+24d58m12s"')
parser.add_argument ('-a', '--altitude', type=float, default=151.6, \
                     help='altitude above sea-level in metre')
parser.add_argument ('-t', '--datetime', default='2000-01-01T12:00:00.000', \
                     help='date/time in UT in "YYYY-MM-DDThh:mm:ss.sss" format')
parser.add_argument ('-o', '--output', default='airmass.png', \
                     help='output file name (EPS, PDF, PNG, or PS file)')
parser.add_argument ('target', nargs='+', default='Vega', \
                     help='names of targets')

# command-line argument analysis
args = parser.parse_args ()

# input parameters
site_lon     = args.longitude
site_lat     = args.latitude
site_alt     = args.altitude * unit_m
datetime_str = args.datetime
file_output  = args.output
list_target  = args.target

# making pathlib object
path_output = pathlib.Path (file_output)
if (path_output.exists ()):
    # printing message
    print ("ERROR: output file '%s' exists." % file_output)
    # exit
    sys.exit ()
if not ( (path_output.suffix == '.eps') or (path_output.suffix == '.pdf') \
         or (path_output.suffix == '.png') or (path_output.suffix == '.ps') ):
    # printing message
    print ("ERROR: output file must be either EPS, PDF, PNG, or PS.")
    # exit
    sys.exit ()

# printing input parameters
print ("#")
print ("# input parameters")
print ("#")
print ("#  Location:")
print ("#   longitude =", site_lon)
print ("#   latitude  =", site_lat)
print ("#   altitude  =", site_alt)
print ("#  Date/Time:")
print ("#   date/time (UT) =", datetime_str)
print ("#  Targets:")
for target in list_target:
    print ("#   %s" % target)
print ("#")

# location object
location = astropy.coordinates.EarthLocation.from_geodetic \
    (site_lon, site_lat, site_alt)

# observer object
observer = astroplan.Observer (location=location, name="observer", \
                               timezone="UTC")

# time object
datetime = astropy.time.Time (datetime_str, scale='utc')
datetime = datetime + numpy.linspace (-8, +8, 100) * unit_hour

# making objects "fig" and "ax"
fig = matplotlib.figure.Figure ()
matplotlib.backends.backend_agg.FigureCanvasAgg (fig)
ax = fig.add_subplot (111)

# plotting
box = ax.get_position ()
ax.set_position ([box.x0, box.y0, box.width * 0.83, box.height])

# processing each target
for i in range ( len (list_target) ):
    # object
    target = list_target[i]
    obj = astroplan.FixedTarget.from_name (target)
    if (i == len (list_target) - 1):
        astroplan.plots.plot_airmass (obj, observer, datetime, ax=ax, \
                                      brightness_shading=True, max_airmass=2.5)
    else:
        astroplan.plots.plot_airmass (obj, observer, datetime, ax=ax)

# plotting
ax.grid ()
ax.legend (bbox_to_anchor=(1.05, 1.00), loc='upper left', shadow=True)

# saving the plot into a file
fig.savefig (file_output, bbox_inches="tight", dpi=225)
実行してみると、以下のようになるでござる。
% ./astroplan_sample_14.py -h
usage: astroplan_sample_14.py [-h] [-l LONGITUDE] [-b LATITUDE] [-a ALTITUDE]
                              [-t DATETIME] [-o OUTPUT]
                              target [target ...]

making an airmass plot

positional arguments:
  target                names of targets

optional arguments:
  -h, --help            show this help message and exit
  -l LONGITUDE, --longitude LONGITUDE
                        longitude of observing site in format "+121d11m12s"
  -b LATITUDE, --latitude LATITUDE
                        latitude of observing site in format "+24d58m12s"
  -a ALTITUDE, --altitude ALTITUDE
                        altitude above sea-level in metre
  -t DATETIME, --datetime DATETIME
                        date/time in UT in "YYYY-MM-DDThh:mm:ss.sss" format
  -o OUTPUT, --output OUTPUT
                        output file name (EPS, PDF, PNG, or PS file)

% ./astroplan_sample_14.py -t 2022-07-03T16:00:00 -o airmass_20220703.png \
? Arcturus Vega Altair Deneb Antares Fomalhaut
#
# input parameters
#
#  Location:
#   longitude = +121d11m12s
#   latitude  = +24d58m12s
#   altitude  = 151.6 m
#  Date/Time:
#   date/time (UT) = 2022-07-03T16:00:00
#  Targets:
#   Arcturus
#   Vega
#   Altair
#   Deneb
#   Antares
#   Fomalhaut
#
/usr/pkg/lib/python3.9/site-packages/astroplan/plots/time_dependent.py:194: UserWarning: linestyle is redundantly defined by the 'linestyle' keyword argument and the fmt string "-" (-> linestyle='-'). The keyword argument will take precedence.
  ax.plot_date(timetoplot.plot_date, masked_airmass, label=target_name, **style_kwargs)
/usr/pkg/lib/python3.9/site-packages/astroplan/plots/time_dependent.py:194: UserWarning: linestyle is redundantly defined by the 'linestyle' keyword argument and the fmt string "-" (-> linestyle='-'). The keyword argument will take precedence.
  ax.plot_date(timetoplot.plot_date, masked_airmass, label=target_name, **style_kwargs)
/usr/pkg/lib/python3.9/site-packages/astroplan/plots/time_dependent.py:194: UserWarning: linestyle is redundantly defined by the 'linestyle' keyword argument and the fmt string "-" (-> linestyle='-'). The keyword argument will take precedence.
  ax.plot_date(timetoplot.plot_date, masked_airmass, label=target_name, **style_kwargs)
/usr/pkg/lib/python3.9/site-packages/astroplan/plots/time_dependent.py:194: UserWarning: linestyle is redundantly defined by the 'linestyle' keyword argument and the fmt string "-" (-> linestyle='-'). The keyword argument will take precedence.
  ax.plot_date(timetoplot.plot_date, masked_airmass, label=target_name, **style_kwargs)
/usr/pkg/lib/python3.9/site-packages/astroplan/plots/time_dependent.py:194: UserWarning: linestyle is redundantly defined by the 'linestyle' keyword argument and the fmt string "-" (-> linestyle='-'). The keyword argument will take precedence.
  ax.plot_date(timetoplot.plot_date, masked_airmass, label=target_name, **style_kwargs)
/usr/pkg/lib/python3.9/site-packages/astroplan/plots/time_dependent.py:194: UserWarning: linestyle is redundantly defined by the 'linestyle' keyword argument and the fmt string "-" (-> linestyle='-'). The keyword argument will take precedence.
  ax.plot_date(timetoplot.plot_date, masked_airmass, label=target_name, **style_kwargs)
% ls -l airmass_20220703.png
-rw-r--r--  1 daisuke  taiwan  174496 Jul  3 12:27 airmass_20220703.png
% feh -dF airmass_20220703.png

|
|---|