 |
|---|
これは日々の作業を通して学んだことや毎日の生活で気づいたことをを記録しておく備忘録である。
HTML ファイル生成日時: 2026/01/27 23:53:50.919 (台灣標準時)
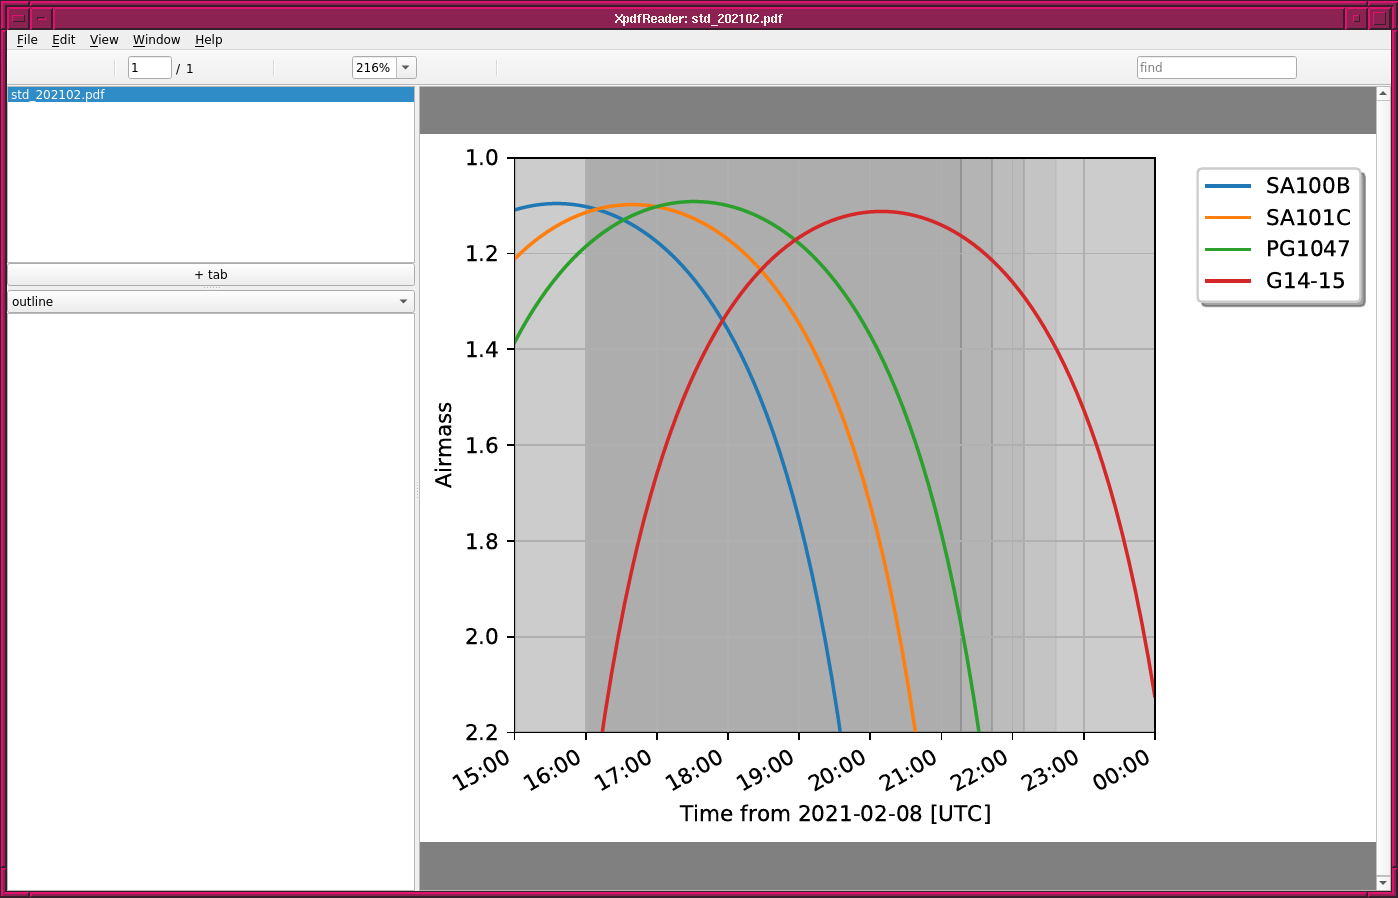
天文観測をする場合には、観測する対象の目標天体がどの時間帯に条件よく観 測できるのか事前に確認しておく必要がある。 airmass が小さいときに条件 よく観測できる。また、測光標準星を観測する場合には、大気減光を評価する ために airmass が小さいときも、大きいときも、観測した方がよいこともあ る。そのため、観測する予定の天体について、時間に対するairmass の変化の 図を作っておくと便利である。そのような図は Astropy の affiliated package で ある astroplan を使 うと手軽に作成することができる。
以下に、 astroplan package を使った airmass plot を作るための Python スクリプトの例を示しておく。
#!/usr/pkg/bin/python3.9

# importing numpy module
import numpy

# importing astropy module
import astropy.time
import astropy.units
import astropy.coordinates

# importing astroplan module
import astroplan
import astroplan.plots

# importing matplotlib module
import matplotlib.figure
import matplotlib.backends.backend_agg

# figure file for saving
file_fig = 'std_202102.pdf'

# units
unit_m = astropy.units.m
unit_hour = astropy.units.hour

# Lulin observatory
lulin_lon = "+120d52m25s"
lulin_lat = "+23d28m07s"
lulin_elev = 2862 * unit_m

# location object
location = astropy.coordinates.EarthLocation.from_geodetic \
    (lulin_lon, lulin_lat, lulin_elev)

# observer object
lulin = astroplan.Observer (location=location, name="Lulin", \
                            timezone="Asia/Taipei")

# date/time
time_str = "2021-02-08T16:00:00"
time     = astropy.time.Time (time_str)
time     = time + numpy.linspace (-1, +8, 100) * unit_hour

# target

coord1 = astropy.coordinates.SkyCoord(133.45491, -0.5591, frame='icrs', unit="deg")
sa100b = astroplan.FixedTarget(name='SA100B', coord=coord1)
coord2 = astropy.coordinates.SkyCoord(149.46882, -0.7934, frame='icrs', unit="deg")
sa101c = astroplan.FixedTarget(name='SA101C', coord=coord2)
coord3 = astropy.coordinates.SkyCoord(162.53305, -0.0346, frame='icrs', unit="deg")
pg1047 = astroplan.FixedTarget(name='PG1047', coord=coord3)
coord4 = astropy.coordinates.SkyCoord(202.08776, -2.3601, frame='icrs', unit="deg")
g14_15 = astroplan.FixedTarget(name='G14-15', coord=coord4)

# making objects "fig" and "ax"
fig = matplotlib.figure.Figure ()
matplotlib.backends.backend_agg.FigureCanvasAgg (fig)
ax = fig.add_subplot (111)

# plotting
box = ax.get_position ()
ax.set_position ([box.x0, box.y0, box.width * 0.83, box.height])
astroplan.plots.plot_airmass (sa100b, lulin, time, ax=ax)
astroplan.plots.plot_airmass (sa101c, lulin, time, ax=ax)
astroplan.plots.plot_airmass (pg1047, lulin, time, ax=ax)
astroplan.plots.plot_airmass (g14_15, lulin, time, ax=ax, \
                              brightness_shading=True, max_airmass=2.2)
ax.grid ()
ax.legend (bbox_to_anchor=(1.05, 1.00), loc='upper left', shadow=True)

# saving the plot into a file
fig.savefig (file_fig, bbox_inches="tight")
これを実行してみる。
% chmod 755 std_202102.py
% ./std_202102.py
% ls -l std_202102.pdf
-rw-r--r--  1 daisuke  wheel  16728 Feb 14 15:42 std_202102.pdf
この場合、 std_202102.pdf というファイルができるので、それを表示してみ る。
% xpdf std_202102.pdf
 |
|---|