|
|---|
これは日々の作業を通して学んだことや毎日の生活で気づいたことをを記録しておく備忘録である。
HTML ファイル生成日時: 2026/01/27 23:53:50.919 (台灣標準時)
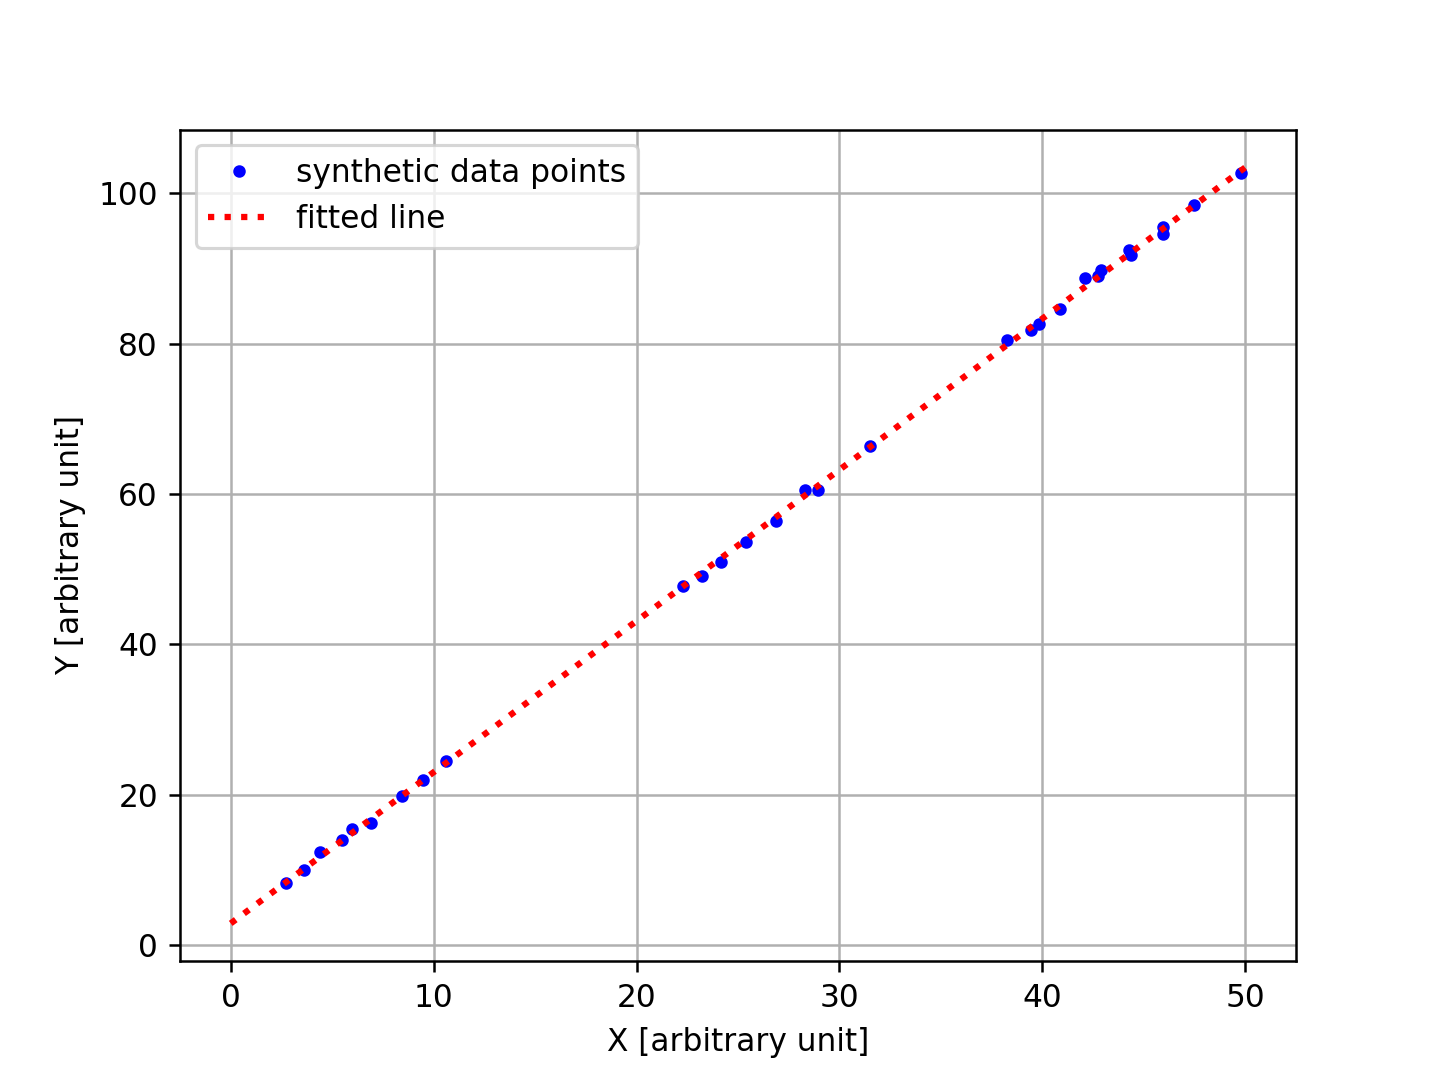
Astropy の astropy.modeling を使って最小二乗法によるフィッティングを行 う方法を調べてみたでござる。その方法を記録しておくでござる。
まず、以下のプログラムで、フィッティングを行うデータを生成するでござる。
#!/usr/pkg/bin/python3.13

#
# Time-stamp: <2025/04/03 21:58:58 (UT+08:00) daisuke>
#

# importing numpy
import numpy

# output file name
file_output = 'synthetic_00.data'

# parameters
x_min = 0.0
x_max = 50.0
n_data = 30
a = 2.0
b = 3.0

# random number generator
rng = numpy.random.default_rng ()

# function y=a*x+b
def func (a, b, x):
    y = a * x + b
    return (y)

# generation of data
data_x = rng.uniform (x_min, x_max, n_data)
data_y = func (a, b, data_x) + rng.normal (loc=0.0, scale=0.5, size=n_data)
data   = numpy.array ([data_x, data_y]).T

# writing data to file
with open (file_output, 'w') as fh_w:
    for (x, y) in data:
        fh_w.write (f'{x:7.3f} {y:7.3f}\n')
上のプログラムを実行してみるでござる。
% python3.13 fitting_astropy_00_generate_data.py
% head synthetic_00.data
  4.402  12.373
 45.926  95.514
 10.593  24.500
 42.116  88.686
 38.252  80.420
  3.602  10.026
 28.959  60.545
 25.399  53.605
 40.849  84.548
 39.854  82.616
最小二乗法によるフィッティングを行うためには、例えば、以下のようなプロ グラムを用意すればよいようでござる。
#!/usr/pkg/bin/python3.13

#
# Time-stamp: <2025/04/03 22:02:55 (UT+08:00) daisuke>
#

# importing numpy module
import numpy

# importing astropy module
import astropy.modeling

# importing matplotlib module
import matplotlib.backends.backend_agg
import matplotlib.figure

# input file name
file_input = 'synthetic_00.data'

# output file name
file_output = 'fitting_00.png'

# making empty lists for storing data
list_x = []
list_y = []

# opening data file
with open (file_input, 'r') as fh_r:
    # reading data file line-by-line
    for line in fh_r:
        # skipping if line starts with '#'
        if (line[0] == '#'):
            continue
        # splitting line
        (x_str, y_str) = line.split ()
        # converting string into float
        try:
            x = float (x_str)
        except:
            continue
        try:
            y = float (y_str)
        except:
            continue
        # appending data to lists
        list_x.append (x)
        list_y.append (y)


# making numpy arrays
array_x = numpy.array (list_x)
array_y = numpy.array (list_y)

# initialisation of fitter
fitter = astropy.modeling.fitting.LevMarLSQFitter (calc_uncertainties=True)

# model used for fitting
model_linear = astropy.modeling.models.Linear1D ()

# carrying out a fitting
fitted_func = fitter (model_linear, array_x, array_y)

# degree of freedom
dof = len (array_x) - 2
print (f'dof = {dof}')

# calculation of reduced chi square
chi_square = sum ( (fitted_func (array_x) - array_y)**2 )
reduced_chi_square = chi_square / dof
print (f'chi square = {chi_square}')
print (f'reduced chi square = {reduced_chi_square}')

# fitted parameters
a = fitted_func.slope.value
b = fitted_func.intercept.value
a_err = (fitter.fit_info['param_cov'][0,0])**0.5
b_err = (fitter.fit_info['param_cov'][1,1])**0.5
print (f'a = {a:8.5f} +/- {a_err:8.5f}')
print (f'b = {b:8.5f} +/- {b_err:8.5f}')

# making a fig object using object-oriented interface
fig = matplotlib.figure.Figure ()

# making a canvas object
canvas = matplotlib.backends.backend_agg.FigureCanvasAgg (fig)

# making an axes object
ax = fig.add_subplot (111)

# plotting data
ax.plot (array_x, array_y, \
         linestyle='None', marker='o', markersize=3, color='blue', \
         label='synthetic data points')

# plotting fitted line
fitted_x = numpy.linspace (0.0, 50.0, 10000)
fitted_y = fitted_func (fitted_x)
ax.plot (fitted_x, fitted_y, \
         linestyle=':', color='red', linewidth=2, \
         label='fitted line')

# axes
ax.legend ()
ax.grid ()
ax.set_xlabel ('X [arbitrary unit]')
ax.set_ylabel ('Y [arbitrary unit]')

# saving plot into file
fig.savefig (file_output, dpi=225)
上のプログラムを実行してみるでござる。
% python3.13 fitting_astropy_01_leastsquares.py
WARNING: Model is linear in parameters; consider using linear fitting methods. [astropy.modeling.fitting]
dof = 28
chi square = 6.482639200079887
reduced chi square = 0.23152282857428166
a =  2.01095 +/-  0.00554
b =  2.89295 +/-  0.17692
作成された図は以下の通りでござる。

|
|---|
gnuplot でも、フィッティングを行ってみて、結果を比べてみるでござる。
% gnuplot

        G N U P L O T
        Version 6.0 patchlevel 1    last modified 2024-05-13

        Copyright (C) 1986-1993, 1998, 2004, 2007-2024
        Thomas Williams, Colin Kelley and many others

        gnuplot home:     http://www.gnuplot.info
        faq, bugs, etc:   type "help FAQ"
        immediate help:   type "help"  (plot window: hit 'h')

        Terminal type is now x11
gnuplot> f(x) = a*x+b
gnuplot> fit f(x) 'synthetic_00.data' using 1:2 via a,b
iter      chisq       delta/lim  lambda   a             b
   0 3.4608242543e+04   0.00e+00  2.26e+01    1.000000e+00   1.000000e+00
   1 4.0754622240e+01  -8.48e+07  2.26e+00    2.043468e+00   1.054945e+00
   2 1.0656335996e+01  -2.82e+05  2.26e-01    2.031357e+00   2.141778e+00
   3 6.4828360181e+00  -6.44e+04  2.26e-02    2.011091e+00   2.887789e+00
   4 6.4826392001e+00  -3.04e+00  2.26e-03    2.010951e+00   2.892947e+00
   5 6.4826392001e+00  -1.50e-08  2.26e-04    2.010951e+00   2.892948e+00
iter      chisq       delta/lim  lambda   a             b

After 5 iterations the fit converged.
final sum of squares of residuals : 6.48264
rel. change during last iteration : -1.50162e-13

degrees of freedom    (FIT_NDF)                        : 28
rms of residuals      (FIT_STDFIT) = sqrt(WSSR/ndf)    : 0.481168
variance of residuals (reduced chisquare) = WSSR/ndf   : 0.231523

Final set of parameters            Asymptotic Standard Error
=======================            ==========================
a               = 2.01095          +/- 0.005536     (0.2753%)
b               = 2.89295          +/- 0.1769       (6.116%)

correlation matrix of the fit parameters:
                a      b
a               1.000
b              -0.868  1.000
gnuplot> exit
同じ結果が得られたでござる。