|
|---|
これは日々の作業を通して学んだことや毎日の生活で気づいたことをを記録しておく備忘録である。
HTML ファイル生成日時: 2026/07/16 23:23:49.686 (台灣標準時)
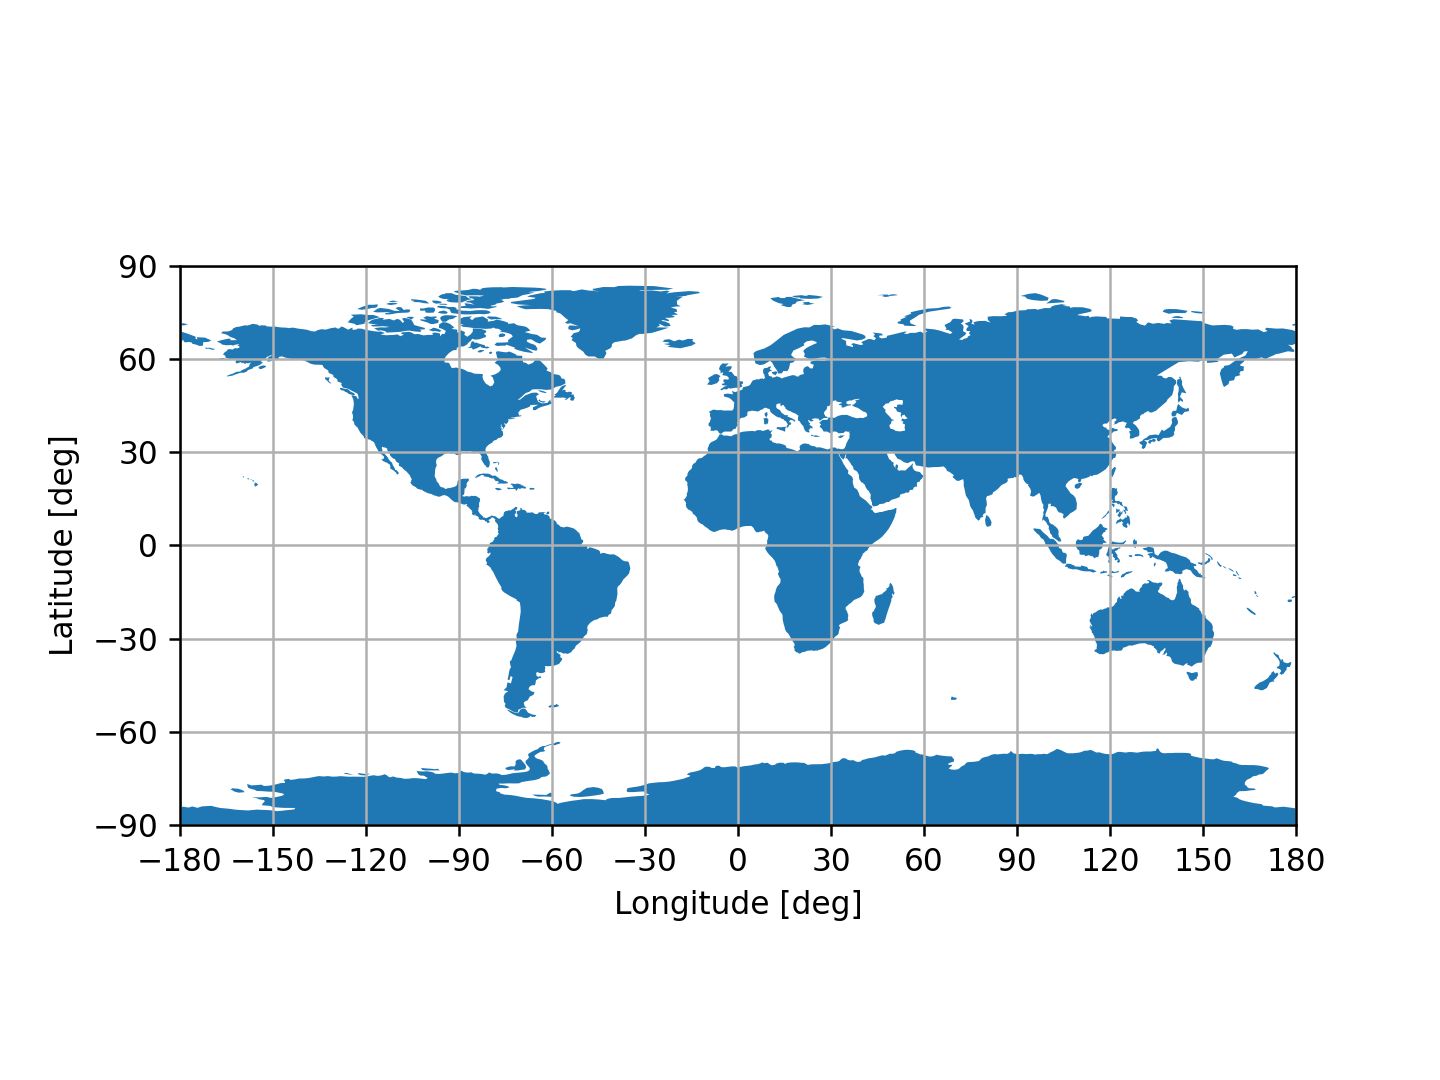
geopandas で地図を描く方法には、 こんな書き方もできるようでござる。 pyplot を使わずに済むでござる。
#!/usr/pkg/bin/python3.13

#
# Time-stamp: <2025/02/02 20:04:55 (UT+8) daisuke>
#

# importing matplotlib
import matplotlib.backends.backend_agg
import matplotlib.figure

# importing geopandas
import geopandas

# importing geodatasets
import geodatasets

# output file name
file_output = 'world_map_3.png'

# making fig object
fig = matplotlib.figure.Figure ()

# making ax object
ax = fig.add_subplot (111)

# importing world map
world = geopandas.read_file (geodatasets.get_path ("naturalearth.land"))

# plotting world map
world.plot (ax=ax)
ax.set_xlabel ('Longitude [deg]')
ax.set_ylabel ('Latitude [deg]')
ax.set_xlim (-180, +180)
ax.set_ylim (-90, +90)
ax.set_xticks (range (-180, +181, 30))
ax.set_yticks (range (-90, +91, 30))
ax.grid ()

# saving file
fig.savefig (file_output, dpi=225)
作られる図は以下の通りでござる。
|
|
|---|