|
|---|
これは日々の作業を通して学んだことや毎日の生活で気づいたことをを記録しておく備忘録である。
HTML ファイル生成日時: 2026/01/27 23:53:50.919 (台灣標準時)
2022 年 5 月 18 日の記 録にアクセスが多く、 "matplotlib 縦横比" や "matplotlib アスペクト比" 、"matplotlib 縦横比 指定 " 、"python グラフ 縦横比" 、 "matplotlib 正方形 " 、 "matplotlib 比率" 、 "matplotlib グラフ 縦横 比" などというキーワードで検索されているようでござる。
もう少ししっかりと調べて記録を残しておくと有用かもしれぬと思い、再度、 matplotlib の ax.axis, ax.set_aspect, ax.set_box_aspect などについて使 い方を調べてみたでござる。
まず、円をプロットすることを考えてみるでござる。半径 10 の円の円周に沿っ て、 36 個の点をプロットしてみるでござる。データは以下の通りでござる。
# data
radius    = 10.0
angle_deg = numpy.linspace (0, 360, 36+1)
angle_rad = numpy.deg2rad (angle_deg)
data_x    = radius * numpy.cos (angle_rad)
data_y    = radius * numpy.sin (angle_rad)
一つ目のプログラムは、特に何の設定もしない場合にござる。
#!/usr/pkg/bin/python3.9

#
# Time-stamp: <2023/05/22 16:39:48 (CST) daisuke>
#

# importing numpy module
import numpy

# importing matplotlib module
import matplotlib.figure
import matplotlib.backends.backend_agg

# output file
file_output = 'test_10.png'

# data
radius    = 10.0
angle_deg = numpy.linspace (0, 360, 36+1)
angle_rad = numpy.deg2rad (angle_deg)
data_x    = radius * numpy.cos (angle_rad)
data_y    = radius * numpy.sin (angle_rad)

# making objects "fig" and "ax"
fig    = matplotlib.figure.Figure ()
canvas = matplotlib.backends.backend_agg.FigureCanvasAgg (fig)
ax     = fig.add_subplot (111)

# axes
ax.set_xlabel ("X")
ax.set_ylabel ("Y")

# plotting data
ax.plot (data_x, data_y, linestyle='None', marker='o', markersize=3, \
         color='red', label='circle')

# saving file
fig.savefig (file_output)
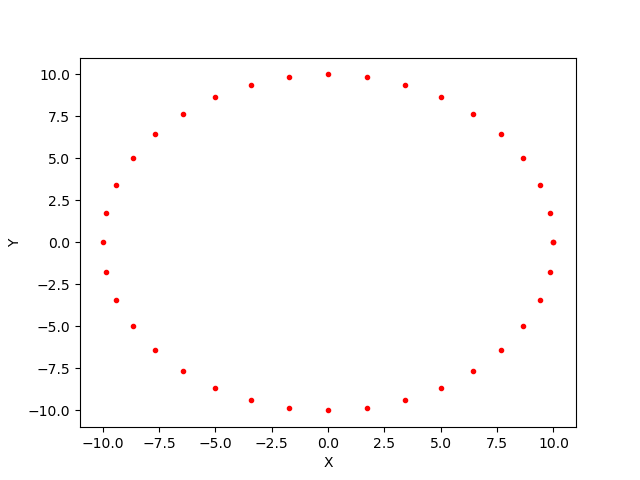
出来上がる図は以下の通りでござる。円なのでござるが、見た目は楕円のよう に描かれてしまっているでござる。

|
|---|
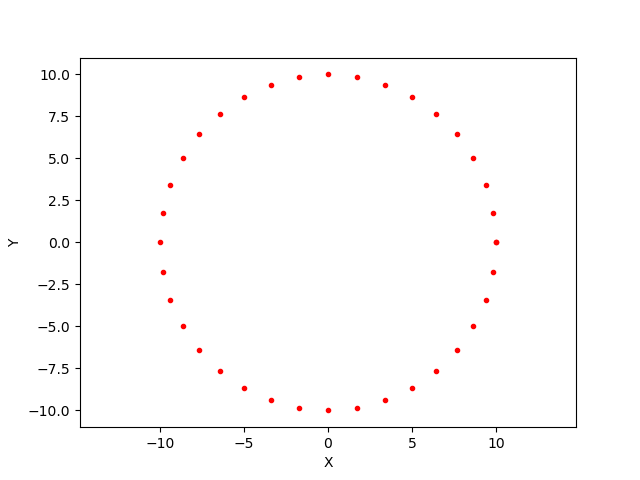
円を円として描きたい場合には、 ax.axis ('equal') を追加すればよいよう でござる。
#!/usr/pkg/bin/python3.9

#
# Time-stamp: <2023/05/22 16:39:57 (CST) daisuke>
#

# importing numpy module
import numpy

# importing matplotlib module
import matplotlib.figure
import matplotlib.backends.backend_agg

# output file
file_output = 'test_11.png'

# data
radius    = 10.0
angle_deg = numpy.linspace (0, 360, 36+1)
angle_rad = numpy.deg2rad (angle_deg)
data_x    = radius * numpy.cos (angle_rad)
data_y    = radius * numpy.sin (angle_rad)

# making objects "fig" and "ax"
fig    = matplotlib.figure.Figure ()
canvas = matplotlib.backends.backend_agg.FigureCanvasAgg (fig)
ax     = fig.add_subplot (111)

# axes
ax.set_xlabel ("X")
ax.set_ylabel ("Y")

# plotting data
ax.plot (data_x, data_y, linestyle='None', marker='o', markersize=3, \
         color='red', label='circle')

# setting for aspect ratio
ax.axis ('equal')

# saving file
fig.savefig (file_output)
出来上がる図は以下の通りでござる。円が円として表示されるようになったで ござる。
|
|---|
次に、 ax.axis ('scaled') を試してみるでござる。
#!/usr/pkg/bin/python3.9

#
# Time-stamp: <2023/05/22 16:40:06 (CST) daisuke>
#

# importing numpy module
import numpy

# importing matplotlib module
import matplotlib.figure
import matplotlib.backends.backend_agg

# output file
file_output = 'test_12.png'

# data
radius    = 10.0
angle_deg = numpy.linspace (0, 360, 36+1)
angle_rad = numpy.deg2rad (angle_deg)
data_x    = radius * numpy.cos (angle_rad)
data_y    = radius * numpy.sin (angle_rad)

# making objects "fig" and "ax"
fig    = matplotlib.figure.Figure ()
canvas = matplotlib.backends.backend_agg.FigureCanvasAgg (fig)
ax     = fig.add_subplot (111)

# axes
ax.set_xlabel ("X")
ax.set_ylabel ("Y")

# plotting data
ax.plot (data_x, data_y, linestyle='None', marker='o', markersize=3, \
         color='red', label='circle')

# setting for aspect ratio
ax.axis ('scaled')

# saving file
fig.savefig (file_output)
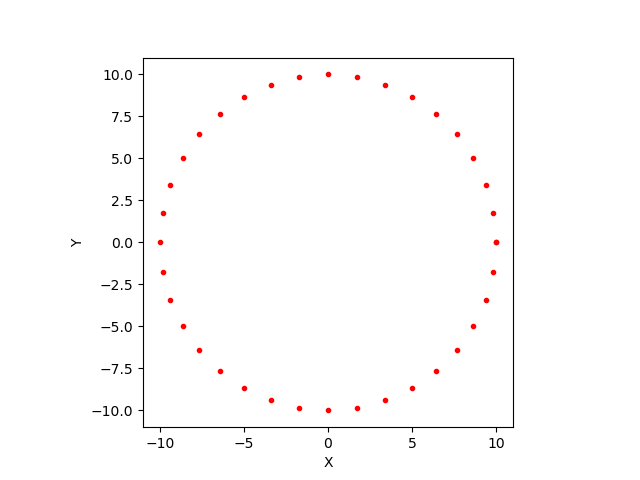
出来上がる図は以下の通りでござる。プロットに使われる領域の大きさが変更 されるでござる。
|
|---|
次に、 ax.axis ('image') を試してみるでござる。
#!/usr/pkg/bin/python3.9

#
# Time-stamp: <2023/05/22 16:40:15 (CST) daisuke>
#

# importing numpy module
import numpy

# importing matplotlib module
import matplotlib.figure
import matplotlib.backends.backend_agg

# output file
file_output = 'test_13.png'

# data
radius    = 10.0
angle_deg = numpy.linspace (0, 360, 36+1)
angle_rad = numpy.deg2rad (angle_deg)
data_x    = radius * numpy.cos (angle_rad)
data_y    = radius * numpy.sin (angle_rad)

# making objects "fig" and "ax"
fig    = matplotlib.figure.Figure ()
canvas = matplotlib.backends.backend_agg.FigureCanvasAgg (fig)
ax     = fig.add_subplot (111)

# axes
ax.set_xlabel ("X")
ax.set_ylabel ("Y")

# plotting data
ax.plot (data_x, data_y, linestyle='None', marker='o', markersize=3, \
         color='red', label='circle')

# setting for aspect ratio
ax.axis ('image')

# saving file
fig.savefig (file_output)
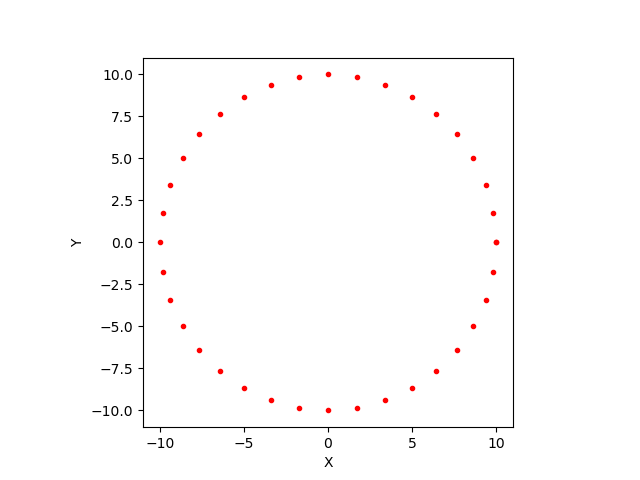
出来上がる図は以下の通りでござる。
|
|---|
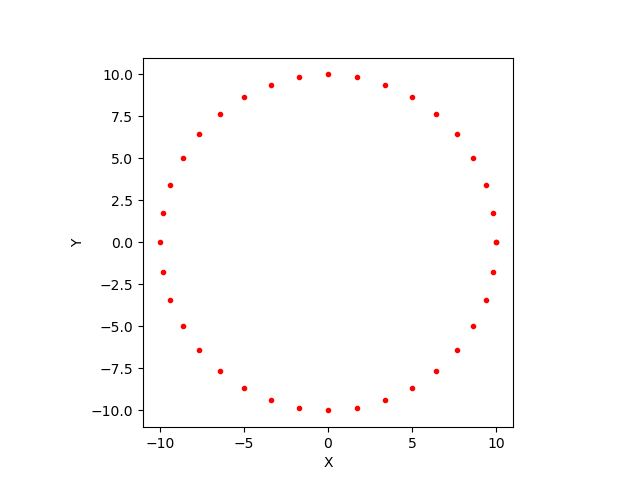
次に、 ax.axis ('square') を試してみるでござる。
#!/usr/pkg/bin/python3.9

#
# Time-stamp: <2023/05/22 16:40:22 (CST) daisuke>
#

# importing numpy module
import numpy

# importing matplotlib module
import matplotlib.figure
import matplotlib.backends.backend_agg

# output file
file_output = 'test_14.png'

# data
radius    = 10.0
angle_deg = numpy.linspace (0, 360, 36+1)
angle_rad = numpy.deg2rad (angle_deg)
data_x    = radius * numpy.cos (angle_rad)
data_y    = radius * numpy.sin (angle_rad)

# making objects "fig" and "ax"
fig    = matplotlib.figure.Figure ()
canvas = matplotlib.backends.backend_agg.FigureCanvasAgg (fig)
ax     = fig.add_subplot (111)

# axes
ax.set_xlabel ("X")
ax.set_ylabel ("Y")

# plotting data
ax.plot (data_x, data_y, linestyle='None', marker='o', markersize=3, \
         color='red', label='circle')

# setting for aspect ratio
ax.axis ('square')

# saving file
fig.savefig (file_output)
出来上がる図は以下の通りでござる。
|
|---|
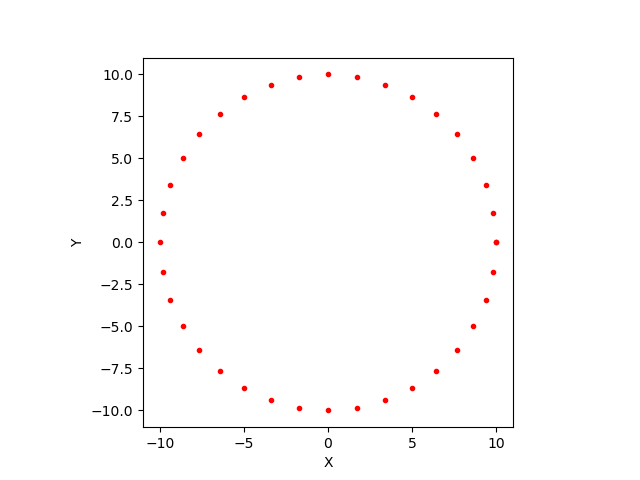
今度は、 ax.set_aspect ('equal') を使ってみるでござる。
#!/usr/pkg/bin/python3.9

#
# Time-stamp: <2023/05/22 16:40:30 (CST) daisuke>
#

# importing numpy module
import numpy

# importing matplotlib module
import matplotlib.figure
import matplotlib.backends.backend_agg

# output file
file_output = 'test_15.png'

# data
radius    = 10.0
angle_deg = numpy.linspace (0, 360, 36+1)
angle_rad = numpy.deg2rad (angle_deg)
data_x    = radius * numpy.cos (angle_rad)
data_y    = radius * numpy.sin (angle_rad)

# making objects "fig" and "ax"
fig    = matplotlib.figure.Figure ()
canvas = matplotlib.backends.backend_agg.FigureCanvasAgg (fig)
ax     = fig.add_subplot (111)

# axes
ax.set_xlabel ("X")
ax.set_ylabel ("Y")

# plotting data
ax.plot (data_x, data_y, linestyle='None', marker='o', markersize=3, \
         color='red', label='circle')

# setting for aspect ratio
ax.set_aspect ('equal')

# saving file
fig.savefig (file_output)
出来上がる図は以下の通りでござる。
|
|---|
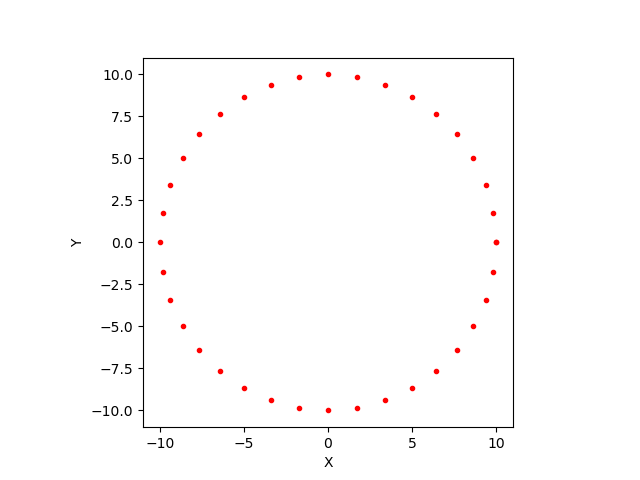
次は、 ax.set_aspect ('equal') に加えて、 ax.set_adjustable ('box') も 指定してみるでござる。
#!/usr/pkg/bin/python3.9

#
# Time-stamp: <2023/05/22 16:40:41 (CST) daisuke>
#

# importing numpy module
import numpy

# importing matplotlib module
import matplotlib.figure
import matplotlib.backends.backend_agg

# output file
file_output = 'test_16.png'

# data
radius    = 10.0
angle_deg = numpy.linspace (0, 360, 36+1)
angle_rad = numpy.deg2rad (angle_deg)
data_x    = radius * numpy.cos (angle_rad)
data_y    = radius * numpy.sin (angle_rad)

# making objects "fig" and "ax"
fig    = matplotlib.figure.Figure ()
canvas = matplotlib.backends.backend_agg.FigureCanvasAgg (fig)
ax     = fig.add_subplot (111)

# axes
ax.set_xlabel ("X")
ax.set_ylabel ("Y")

# plotting data
ax.plot (data_x, data_y, linestyle='None', marker='o', markersize=3, \
         color='red', label='circle')

# setting for aspect ratio
ax.set_aspect ('equal')
ax.set_adjustable ('box')

# saving file
fig.savefig (file_output)
出来上がる図は以下の通りでござる。
|
|---|
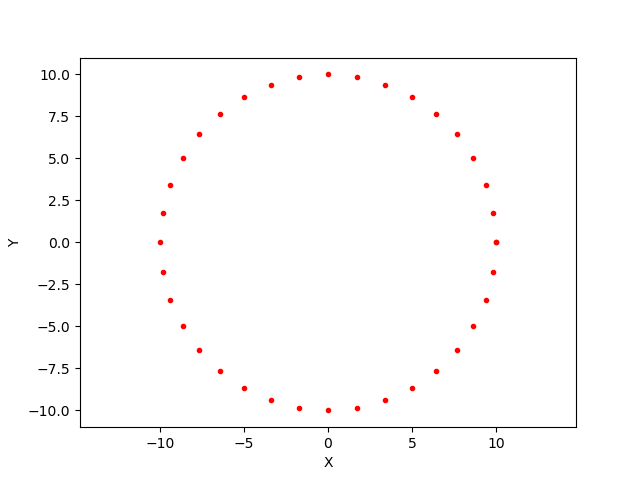
次は、 ax.set_aspect ('equal') と ax.set_adjustable ('datalim') の両方 を指定してみるでござる。
#!/usr/pkg/bin/python3.9

#
# Time-stamp: <2023/05/22 16:40:49 (CST) daisuke>
#

# importing numpy module
import numpy

# importing matplotlib module
import matplotlib.figure
import matplotlib.backends.backend_agg

# output file
file_output = 'test_17.png'

# data
radius    = 10.0
angle_deg = numpy.linspace (0, 360, 36+1)
angle_rad = numpy.deg2rad (angle_deg)
data_x    = radius * numpy.cos (angle_rad)
data_y    = radius * numpy.sin (angle_rad)

# making objects "fig" and "ax"
fig    = matplotlib.figure.Figure ()
canvas = matplotlib.backends.backend_agg.FigureCanvasAgg (fig)
ax     = fig.add_subplot (111)

# axes
ax.set_xlabel ("X")
ax.set_ylabel ("Y")

# plotting data
ax.plot (data_x, data_y, linestyle='None', marker='o', markersize=3, \
         color='red', label='circle')

# setting for aspect ratio
ax.set_aspect ('equal')
ax.set_adjustable ('datalim')

# saving file
fig.savefig (file_output)
出来上がる図は以下の通りでござる。
|
|---|
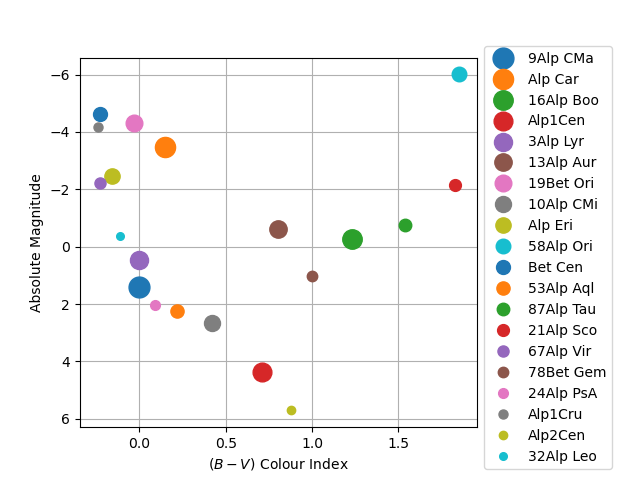
更に、図を正方形にしたい場合のことを考えてみるでござる。 X 軸と Y 軸の スケールを 1:1 にしたいのではなく、出来上がる図を正方形にしたいという ことでござる。まずは、何も指定せずに図を作ってみるでござる。
#!/usr/pkg/bin/python3.9

#
# Time-stamp: <2023/05/22 16:46:47 (CST) daisuke>
#

# importing gzip module
import gzip

# importing numpy module
import numpy

# importing matplotlib module
import matplotlib.figure
import matplotlib.backends.backend_agg

# catalogue file name
file_catalogue = 'catalog.gz'

# output file name
file_output = 'test_20.png'

# dictionary for storing data
stars = {}

# opening catalogue file
with gzip.open (file_catalogue, 'rb') as fh:
    # reading catalogue line-by-line
    for line in fh:
        # Harvard Revised Number of star
        HR = line[0:4].strip ()
        # name
        name = line[4:14].strip ()
        # Vmag
        mag_V = line[102:107].strip ()
        # B-V colour
        colour_BV = line[109:114].strip ()
        # spectral type
        sptype = line[127:147].strip ()
        # dynamical parallax flag
        dynamical_parallax = line[160]
        # parallax
        parallax = line[161:166]

        # skip, if any of mag_V, colour_BV, parallax is missing
        if ( (mag_V == '') or (colour_BV == '') or (parallax == '') ):
            continue
        # skip, if parallax is dynamical parallax
        if (dynamical_parallax == 'D'):
            continue
        # reformat parallax
        if (parallax[:2] == '+.'):
            parallax = '+0.' + parallax[2:]

        # conversion from string to float
        try:
            mag_V     = float (mag_V)
        except:
            continue
        try:
            colour_BV = float (colour_BV)
        except:
            continue
        try:
            parallax  = float (parallax)
        except:
            continue

        # skip, if parallax is negative
        if (parallax < 0.0):
            continue

        # skip, if parallax is zero
        if (parallax < 10**-4):
            continue

        # distance in parsec
        dist_pc = 1.0 / parallax

        # absolute magnitude
        absmag_V = mag_V - 5.0 * numpy.log10 (dist_pc) + 5.0

        # constructing the dictionary
        stars[HR] = {}
        stars[HR]["mag_V"]     = mag_V
        stars[HR]["colour_BV"] = colour_BV
        stars[HR]["parallax"]  = parallax
        stars[HR]["dist_pc"]   = dist_pc
        stars[HR]["absmag_V"]  = absmag_V
        stars[HR]["sptype"]    = sptype
        stars[HR]["name"]      = name

# making empty numpy arrays for plotting
colour = numpy.array ([])
absmag = numpy.array ([])
label  = numpy.array ([], dtype=str)

# printing header
print ("# Vmag, (B-V), parallax, distance, absmag_V, HR, name")

# printing information of 1st mag stars
for key, value in sorted (stars.items (), key=lambda x: x[1]['mag_V']):
    # if mag of star is equal to or greater than 1.5, then skip
    if (stars[key]['mag_V'] >= 1.5):
        break
    # printing information
    print (f'{stars[key]["mag_V"]:+6.3f} ', \
           f'{stars[key]["colour_BV"]:+6.3f} ', \
           f'{stars[key]["parallax"]:+6.3f} ', \
           f'{stars[key]["dist_pc"]:+8.3f} ', \
           f'{stars[key]["absmag_V"]:+6.3f} ', \
           f'{int (key.decode ("utf-8")):4d} ', \
           f'{stars[key]["name"].decode ("utf-8")}')
    # appending data into numpy arrays
    colour = numpy.append (colour, stars[key]['colour_BV'])
    absmag = numpy.append (absmag, stars[key]['absmag_V'])
    label  = numpy.append (label, f'{stars[key]["name"].decode ("utf-8")}')

# making a fig object
fig = matplotlib.figure.Figure ()

# making a canvas object
canvas = matplotlib.backends.backend_agg.FigureCanvasAgg (fig)

# making an axes object
ax = fig.add_subplot (111)

# adjustment of plot
box = ax.get_position ()
ax.set_position ([box.x0, box.y0, box.width * 0.8, box.height])

# labels
ax.set_xlabel ('$(B-V)$ Colour Index')
ax.set_ylabel ('Absolute Magnitude')

# flipping direction of Y-axis
ax.invert_yaxis ()

# plotting data
for i in range (len (colour)):
    size = 15 - i * 0.5
    ax.plot (colour[i], absmag[i], linestyle='None', marker='o', \
             markersize=size, label=label[i])

# grid
ax.grid ()

# legend
ax.legend (bbox_to_anchor=(1.0, 1.05), loc='upper left')

# saving the figure to a file
fig.savefig (file_output)
出来上がるのは、明るい恒星の H-R 図でござる。
|
|---|
次に、 ax.axis ('tight') を試してみるでござる。
#!/usr/pkg/bin/python3.9

#
# Time-stamp: <2023/05/22 16:46:47 (CST) daisuke>
#

# importing gzip module
import gzip

# importing numpy module
import numpy

# importing matplotlib module
import matplotlib.figure
import matplotlib.backends.backend_agg

# catalogue file name
file_catalogue = 'catalog.gz'

# output file name
file_output = 'test_20.png'

# dictionary for storing data
stars = {}

# opening catalogue file
with gzip.open (file_catalogue, 'rb') as fh:
    # reading catalogue line-by-line
    for line in fh:
        # Harvard Revised Number of star
        HR = line[0:4].strip ()
        # name
        name = line[4:14].strip ()
        # Vmag
        mag_V = line[102:107].strip ()
        # B-V colour
        colour_BV = line[109:114].strip ()
        # spectral type
        sptype = line[127:147].strip ()
        # dynamical parallax flag
        dynamical_parallax = line[160]
        # parallax
        parallax = line[161:166]

        # skip, if any of mag_V, colour_BV, parallax is missing
        if ( (mag_V == '') or (colour_BV == '') or (parallax == '') ):
            continue
        # skip, if parallax is dynamical parallax
        if (dynamical_parallax == 'D'):
            continue
        # reformat parallax
        if (parallax[:2] == '+.'):
            parallax = '+0.' + parallax[2:]

        # conversion from string to float
        try:
            mag_V     = float (mag_V)
        except:
            continue
        try:
            colour_BV = float (colour_BV)
        except:
            continue
        try:
            parallax  = float (parallax)
        except:
            continue

        # skip, if parallax is negative
        if (parallax < 0.0):
            continue

        # skip, if parallax is zero
        if (parallax < 10**-4):
            continue

        # distance in parsec
        dist_pc = 1.0 / parallax

        # absolute magnitude
        absmag_V = mag_V - 5.0 * numpy.log10 (dist_pc) + 5.0

        # constructing the dictionary
        stars[HR] = {}
        stars[HR]["mag_V"]     = mag_V
        stars[HR]["colour_BV"] = colour_BV
        stars[HR]["parallax"]  = parallax
        stars[HR]["dist_pc"]   = dist_pc
        stars[HR]["absmag_V"]  = absmag_V
        stars[HR]["sptype"]    = sptype
        stars[HR]["name"]      = name

# making empty numpy arrays for plotting
colour = numpy.array ([])
absmag = numpy.array ([])
label  = numpy.array ([], dtype=str)

# printing header
print ("# Vmag, (B-V), parallax, distance, absmag_V, HR, name")

# printing information of 1st mag stars
for key, value in sorted (stars.items (), key=lambda x: x[1]['mag_V']):
    # if mag of star is equal to or greater than 1.5, then skip
    if (stars[key]['mag_V'] >= 1.5):
        break
    # printing information
    print (f'{stars[key]["mag_V"]:+6.3f} ', \
           f'{stars[key]["colour_BV"]:+6.3f} ', \
           f'{stars[key]["parallax"]:+6.3f} ', \
           f'{stars[key]["dist_pc"]:+8.3f} ', \
           f'{stars[key]["absmag_V"]:+6.3f} ', \
           f'{int (key.decode ("utf-8")):4d} ', \
           f'{stars[key]["name"].decode ("utf-8")}')
    # appending data into numpy arrays
    colour = numpy.append (colour, stars[key]['colour_BV'])
    absmag = numpy.append (absmag, stars[key]['absmag_V'])
    label  = numpy.append (label, f'{stars[key]["name"].decode ("utf-8")}')

# making a fig object
fig = matplotlib.figure.Figure ()

# making a canvas object
canvas = matplotlib.backends.backend_agg.FigureCanvasAgg (fig)

# making an axes object
ax = fig.add_subplot (111)

# adjustment of plot
box = ax.get_position ()
ax.set_position ([box.x0, box.y0, box.width * 0.8, box.height])

# labels
ax.set_xlabel ('$(B-V)$ Colour Index')
ax.set_ylabel ('Absolute Magnitude')

# flipping direction of Y-axis
ax.invert_yaxis ()

# plotting data
for i in range (len (colour)):
    size = 15 - i * 0.5
    ax.plot (colour[i], absmag[i], linestyle='None', marker='o', \
             markersize=size, label=label[i])

# grid
ax.grid ()

# legend
ax.legend (bbox_to_anchor=(1.0, 1.05), loc='upper left')

# saving the figure to a file
fig.savefig (file_output)
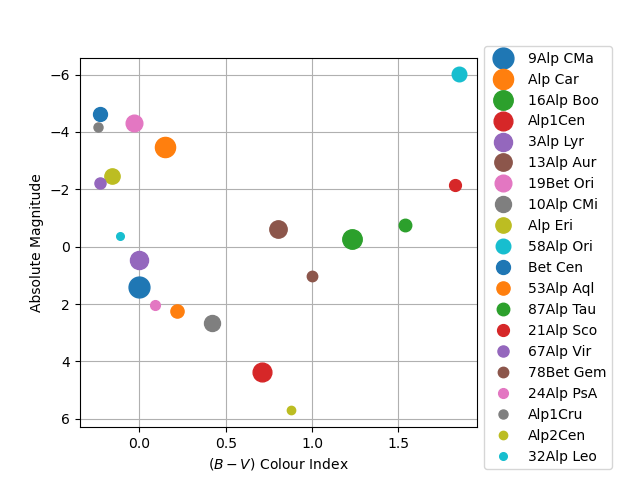
出来上がる H-R 図は以下の通りでござる。

|
|---|
次に、 ax.axis ('tight') を試してみるでござる。
#!/usr/pkg/bin/python3.9

#
# Time-stamp: <2023/05/22 16:49:50 (CST) daisuke>
#

# importing gzip module
import gzip

# importing numpy module
import numpy

# importing matplotlib module
import matplotlib.figure
import matplotlib.backends.backend_agg

# catalogue file name
file_catalogue = 'catalog.gz'

# output file name
file_output = 'test_21.png'

# dictionary for storing data
stars = {}

# opening catalogue file
with gzip.open (file_catalogue, 'rb') as fh:
    # reading catalogue line-by-line
    for line in fh:
        # Harvard Revised Number of star
        HR = line[0:4].strip ()
        # name
        name = line[4:14].strip ()
        # Vmag
        mag_V = line[102:107].strip ()
        # B-V colour
        colour_BV = line[109:114].strip ()
        # spectral type
        sptype = line[127:147].strip ()
        # dynamical parallax flag
        dynamical_parallax = line[160]
        # parallax
        parallax = line[161:166]

        # skip, if any of mag_V, colour_BV, parallax is missing
        if ( (mag_V == '') or (colour_BV == '') or (parallax == '') ):
            continue
        # skip, if parallax is dynamical parallax
        if (dynamical_parallax == 'D'):
            continue
        # reformat parallax
        if (parallax[:2] == '+.'):
            parallax = '+0.' + parallax[2:]

        # conversion from string to float
        try:
            mag_V     = float (mag_V)
        except:
            continue
        try:
            colour_BV = float (colour_BV)
        except:
            continue
        try:
            parallax  = float (parallax)
        except:
            continue

        # skip, if parallax is negative
        if (parallax < 0.0):
            continue

        # skip, if parallax is zero
        if (parallax < 10**-4):
            continue

        # distance in parsec
        dist_pc = 1.0 / parallax

        # absolute magnitude
        absmag_V = mag_V - 5.0 * numpy.log10 (dist_pc) + 5.0

        # constructing the dictionary
        stars[HR] = {}
        stars[HR]["mag_V"]     = mag_V
        stars[HR]["colour_BV"] = colour_BV
        stars[HR]["parallax"]  = parallax
        stars[HR]["dist_pc"]   = dist_pc
        stars[HR]["absmag_V"]  = absmag_V
        stars[HR]["sptype"]    = sptype
        stars[HR]["name"]      = name

# making empty numpy arrays for plotting
colour = numpy.array ([])
absmag = numpy.array ([])
label  = numpy.array ([], dtype=str)

# printing header
print ("# Vmag, (B-V), parallax, distance, absmag_V, HR, name")

# printing information of 1st mag stars
for key, value in sorted (stars.items (), key=lambda x: x[1]['mag_V']):
    # if mag of star is equal to or greater than 1.5, then skip
    if (stars[key]['mag_V'] >= 1.5):
        break
    # printing information
    print (f'{stars[key]["mag_V"]:+6.3f} ', \
           f'{stars[key]["colour_BV"]:+6.3f} ', \
           f'{stars[key]["parallax"]:+6.3f} ', \
           f'{stars[key]["dist_pc"]:+8.3f} ', \
           f'{stars[key]["absmag_V"]:+6.3f} ', \
           f'{int (key.decode ("utf-8")):4d} ', \
           f'{stars[key]["name"].decode ("utf-8")}')
    # appending data into numpy arrays
    colour = numpy.append (colour, stars[key]['colour_BV'])
    absmag = numpy.append (absmag, stars[key]['absmag_V'])
    label  = numpy.append (label, f'{stars[key]["name"].decode ("utf-8")}')

# making a fig object
fig = matplotlib.figure.Figure ()

# making a canvas object
canvas = matplotlib.backends.backend_agg.FigureCanvasAgg (fig)

# making an axes object
ax = fig.add_subplot (111)

# adjustment of plot
box = ax.get_position ()
ax.set_position ([box.x0, box.y0, box.width * 0.8, box.height])

# labels
ax.set_xlabel ('$(B-V)$ Colour Index')
ax.set_ylabel ('Absolute Magnitude')

# flipping direction of Y-axis
ax.invert_yaxis ()

# plotting data
for i in range (len (colour)):
    size = 15 - i * 0.5
    ax.plot (colour[i], absmag[i], linestyle='None', marker='o', \
             markersize=size, label=label[i])

# setting for aspect ratio
ax.axis ('tight')

# grid
ax.grid ()

# legend
ax.legend (bbox_to_anchor=(1.0, 1.05), loc='upper left')

# saving the figure to a file
fig.savefig (file_output)
出来上がる図は、前のものと同じでござる。
|
|---|
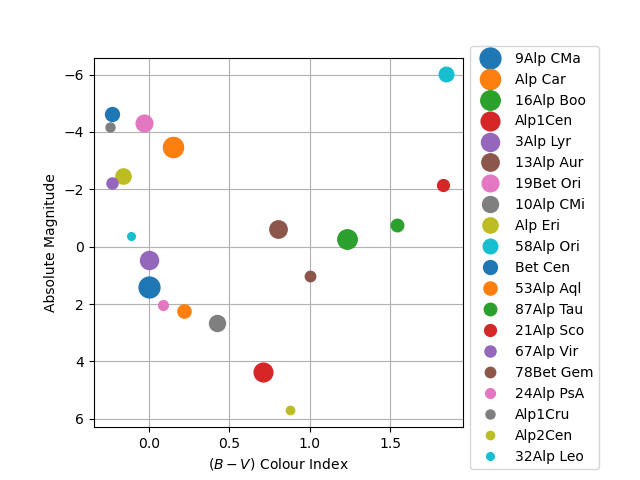
今度は、 ax.set_box_aspect (aspect=1.0) を試してみるでござる。
#!/usr/pkg/bin/python3.9

#
# Time-stamp: <2023/05/22 16:55:52 (CST) daisuke>
#

# importing gzip module
import gzip

# importing numpy module
import numpy

# importing matplotlib module
import matplotlib.figure
import matplotlib.backends.backend_agg

# catalogue file name
file_catalogue = 'catalog.gz'

# output file name
file_output = 'test_22.png'

# dictionary for storing data
stars = {}

# opening catalogue file
with gzip.open (file_catalogue, 'rb') as fh:
    # reading catalogue line-by-line
    for line in fh:
        # Harvard Revised Number of star
        HR = line[0:4].strip ()
        # name
        name = line[4:14].strip ()
        # Vmag
        mag_V = line[102:107].strip ()
        # B-V colour
        colour_BV = line[109:114].strip ()
        # spectral type
        sptype = line[127:147].strip ()
        # dynamical parallax flag
        dynamical_parallax = line[160]
        # parallax
        parallax = line[161:166]

        # skip, if any of mag_V, colour_BV, parallax is missing
        if ( (mag_V == '') or (colour_BV == '') or (parallax == '') ):
            continue
        # skip, if parallax is dynamical parallax
        if (dynamical_parallax == 'D'):
            continue
        # reformat parallax
        if (parallax[:2] == '+.'):
            parallax = '+0.' + parallax[2:]

        # conversion from string to float
        try:
            mag_V     = float (mag_V)
        except:
            continue
        try:
            colour_BV = float (colour_BV)
        except:
            continue
        try:
            parallax  = float (parallax)
        except:
            continue

        # skip, if parallax is negative
        if (parallax < 0.0):
            continue

        # skip, if parallax is zero
        if (parallax < 10**-4):
            continue

        # distance in parsec
        dist_pc = 1.0 / parallax

        # absolute magnitude
        absmag_V = mag_V - 5.0 * numpy.log10 (dist_pc) + 5.0

        # constructing the dictionary
        stars[HR] = {}
        stars[HR]["mag_V"]     = mag_V
        stars[HR]["colour_BV"] = colour_BV
        stars[HR]["parallax"]  = parallax
        stars[HR]["dist_pc"]   = dist_pc
        stars[HR]["absmag_V"]  = absmag_V
        stars[HR]["sptype"]    = sptype
        stars[HR]["name"]      = name

# making empty numpy arrays for plotting
colour = numpy.array ([])
absmag = numpy.array ([])
label  = numpy.array ([], dtype=str)

# printing header
print ("# Vmag, (B-V), parallax, distance, absmag_V, HR, name")

# printing information of 1st mag stars
for key, value in sorted (stars.items (), key=lambda x: x[1]['mag_V']):
    # if mag of star is equal to or greater than 1.5, then skip
    if (stars[key]['mag_V'] >= 1.5):
        break
    # printing information
    print (f'{stars[key]["mag_V"]:+6.3f} ', \
           f'{stars[key]["colour_BV"]:+6.3f} ', \
           f'{stars[key]["parallax"]:+6.3f} ', \
           f'{stars[key]["dist_pc"]:+8.3f} ', \
           f'{stars[key]["absmag_V"]:+6.3f} ', \
           f'{int (key.decode ("utf-8")):4d} ', \
           f'{stars[key]["name"].decode ("utf-8")}')
    # appending data into numpy arrays
    colour = numpy.append (colour, stars[key]['colour_BV'])
    absmag = numpy.append (absmag, stars[key]['absmag_V'])
    label  = numpy.append (label, f'{stars[key]["name"].decode ("utf-8")}')

# making a fig object
fig = matplotlib.figure.Figure ()

# making a canvas object
canvas = matplotlib.backends.backend_agg.FigureCanvasAgg (fig)

# making an axes object
ax = fig.add_subplot (111)

# adjustment of plot
box = ax.get_position ()
ax.set_position ([box.x0, box.y0, box.width * 0.8, box.height])

# labels
ax.set_xlabel ('$(B-V)$ Colour Index')
ax.set_ylabel ('Absolute Magnitude')

# flipping direction of Y-axis
ax.invert_yaxis ()

# plotting data
for i in range (len (colour)):
    size = 15 - i * 0.5
    ax.plot (colour[i], absmag[i], linestyle='None', marker='o', \
             markersize=size, label=label[i])

# setting for aspect ratio
ax.set_box_aspect (aspect=1.0)

# grid
ax.grid ()

# legend
ax.legend (bbox_to_anchor=(1.0, 1.05), loc='upper left')

# saving the figure to a file
fig.savefig (file_output)
今度は、期待通りに、正方形の図になったでござる。
|
|---|