
|
|---|
これは日々の作業を通して学んだことや毎日の生活で気づいたことをを記録しておく備忘録である。
HTML ファイル生成日時: 2026/07/13 08:38:38.349 (台灣標準時)
Matplotlib を使うと、高品質な図 を作ることができるでござる。プログラムを書いて作図をするので、 PGPLOT を思い 出させるでござる。 Matplotlib はとてもよいのでござるが、使い方に、関数 を使う procedural な pyplot interface と、メソッドを使う object-oriented interface の二つがあり、解説によって、 pyplot interface を使っていたり、 object-oriented interface を使っていたりす るので、最初のうちは混乱する場合があるでござる。 Python のモジュールに よっては、 pyplot interface でないと使えないようになっていたりするもの もあるでござる。
Matplotlib のウェブページには、以下のように記述されているでござる。
複雑な図を作ったり、或いは、コードを再利用しようと思っている場合には object-oriented style がよく、対話的にお試しで作図してみようというよう な場合には pyplot style がよいとのことでござる。Matplotlib's documentation and examples use both the OO and the pyplot styles. In general, we suggest using the OO style, particularly for complicated plots, and functions and scripts that are intended to be reused as part of a larger project. However, the pyplot style can be very convenient for quick interactive work.
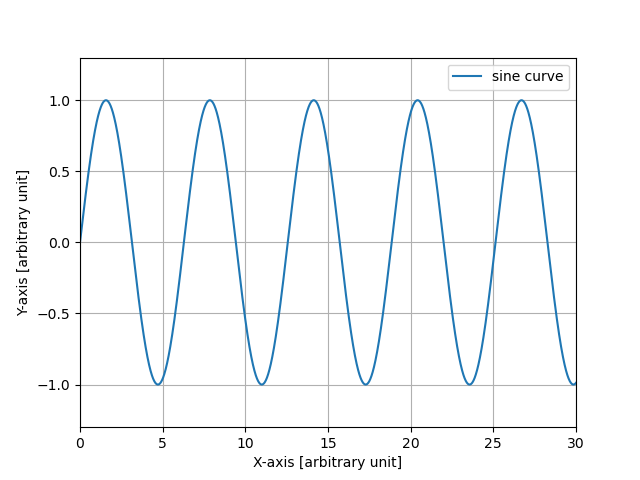
pyplot interface を使った作図の例は以下の通りでござる。
#!/usr/pkg/bin/python3.9

#
# Time-stamp: <2022/08/16 16:37:18 (CST) daisuke>
#

# importing numpy module
import numpy

# importing matplotlib module
import matplotlib.pyplot

# making numpy arrays
data_x = numpy.linspace (0.0, 30.0, 3001)
data_y = numpy.sin (data_x)

# making a plot using procedural pyplot interface
matplotlib.pyplot.figure ()
matplotlib.pyplot.plot (data_x, data_y, label="sine curve")
matplotlib.pyplot.xlim (0.0, 30.0)
matplotlib.pyplot.ylim (-1.3, +1.3)
matplotlib.pyplot.xlabel ("X-axis [arbitrary unit]")
matplotlib.pyplot.ylabel ("Y-axis [arbitrary unit]")
matplotlib.pyplot.legend ()
matplotlib.pyplot.grid ()

# producing a plot as an output file
matplotlib.pyplot.savefig ("test_pyplot_00.png")
|
|
|---|
単純な図の場合なら、
matplotlib.pyplot.figure ()がなくても 作図できるようでござる。
#!/usr/pkg/bin/python3.9

#
# Time-stamp: <2022/08/16 16:37:27 (CST) daisuke>
#

# importing numpy module
import numpy

# importing matplotlib module
import matplotlib.pyplot

# making numpy arrays
data_x = numpy.linspace (0.0, 30.0, 3001)
data_y = numpy.sin (data_x)

# making a plot using procedural pyplot interface
#matplotlib.pyplot.figure ()
matplotlib.pyplot.plot (data_x, data_y, label="sine curve")
matplotlib.pyplot.xlim (0.0, 30.0)
matplotlib.pyplot.ylim (-1.3, +1.3)
matplotlib.pyplot.xlabel ("X-axis [arbitrary unit]")
matplotlib.pyplot.ylabel ("Y-axis [arbitrary unit]")
matplotlib.pyplot.legend ()
matplotlib.pyplot.grid ()

# producing a plot as an output file
matplotlib.pyplot.savefig ("test_pyplot_01.png")
|
|---|
次に、 object-oriented interface を使った作図の例でござる。 fig object を作るところは、 figure () 関数で行い、その後の部分をメソッドを使って 行っているでござる。
#!/usr/pkg/bin/python3.9

#
# Time-stamp: <2022/08/16 16:37:36 (CST) daisuke>
#

# importing numpy module
import numpy

# importing matplotlib module
import matplotlib.pyplot

# making numpy arrays
data_x = numpy.linspace (0.0, 30.0, 3001)
data_y = numpy.sin (data_x)

# making a fig object using matplot.pyplot.figure function
fig = matplotlib.pyplot.figure ()

# making an axes object using object-oriented interface
ax = fig.add_subplot (111)

# making a plot using object-oriented interface
ax.plot (data_x, data_y, label="sine curve")
ax.set_xlim (0.0, 30.0)
ax.set_ylim (-1.3, +1.3)
ax.set_xlabel ("X-axis [arbitrary unit]")
ax.set_ylabel ("Y-axis [arbitrary unit]")
ax.legend ()
ax.grid ()

# producing a plot as an output file
fig.savefig ("test_oo_00.png")

|
|---|
fig オブジェクトと ax オブジェクトを subplots () 関数を使って作り、そ の後、メソッドを使って作図することもできるようでござる。
#!/usr/pkg/bin/python3.9

#
# Time-stamp: <2022/08/16 16:37:45 (CST) daisuke>
#

# importing numpy module
import numpy

# importing matplotlib module
import matplotlib.pyplot

# making numpy arrays
data_x = numpy.linspace (0.0, 30.0, 3001)
data_y = numpy.sin (data_x)

# making a fig and an axes objects using matplot.pyplot.subplots function
fig, ax = matplotlib.pyplot.subplots ()

# making a plot using object-oriented interface
ax.plot (data_x, data_y, label="sine curve")
ax.set_xlim (0.0, 30.0)
ax.set_ylim (-1.3, +1.3)
ax.set_xlabel ("X-axis [arbitrary unit]")
ax.set_ylabel ("Y-axis [arbitrary unit]")
ax.legend ()
ax.grid ()

# producing a plot as an output file
fig.savefig ("test_oo_01.png")

|
|---|
pyplot の関数を一切使わずに、作図することもできるでござる。
#!/usr/pkg/bin/python3.9

#
# Time-stamp: <2022/08/16 16:37:53 (CST) daisuke>
#

# importing numpy module
import numpy

# importing matplotlib module
import matplotlib.backends.backend_agg
import matplotlib.figure

# making numpy arrays
data_x = numpy.linspace (0.0, 30.0, 3001)
data_y = numpy.sin (data_x)

# making a fig object using object-oriented interface
fig = matplotlib.figure.Figure ()

# making a canvas object
canvas = matplotlib.backends.backend_agg.FigureCanvasAgg (fig)

# making an axes object
ax = fig.add_subplot (111)

# making a plot using object-oriented interface
ax.plot (data_x, data_y, label="sine curve")
ax.set_xlim (0.0, 30.0)
ax.set_ylim (-1.3, +1.3)
ax.set_xlabel ("X-axis [arbitrary unit]")
ax.set_ylabel ("Y-axis [arbitrary unit]")
ax.legend ()
ax.grid ()

# producing a plot as an output file
fig.savefig ("test_pureoo_00.png")

|
|---|