|
|---|
これは日々の作業を通して学んだことや毎日の生活で気づいたことをを記録しておく備忘録である。
HTML ファイル生成日時: 2026/01/27 23:53:50.919 (台灣標準時)
Scipy に ODR (Orthogonal Distance Regression) を行ってくれるサブモジュー ルがあるようなので試してみたでござる。その方法を記録しておくでござる。
まず、データを用意するでござる。
#!/usr/pkg/bin/python3.13

#
# Time-stamp: <2025/03/16 13:12:01 (UT+08:00) daisuke>
#

# importing numpy module
import numpy

# parameters
a           = 7.0
b           = 11.0
xerr_mean   = 0.5
xerr_stddev = 0.2
yerr_mean   = 1.5
yerr_stddev = 0.6
x_min       = -10.0
x_max       = +10.0
n_data      = 21
file_output = 'test_scipy_odr_00.data'

# function for generating data
def func (x, a, b):
    y = a * x + b
    return (y)

# random number generator
rng = numpy.random.default_rng ()

# generating synthetic data
x = numpy.linspace (x_min, x_max, n_data) \
    + numpy.absolute (
        rng.normal (loc=xerr_mean, scale=xerr_stddev, size=n_data) )
x_err = numpy.absolute (
    rng.normal (loc=xerr_mean, scale=xerr_stddev, size=n_data) )
y = func (numpy.linspace (x_min, x_max, n_data), a, b) \
    + numpy.absolute (
        rng.normal (loc=yerr_mean, scale=yerr_stddev, size=n_data) )
y_err = numpy.absolute (
    rng.normal (loc=yerr_mean, scale=yerr_stddev, size=n_data) )

# writing generated synthetic data to a file
with open (file_output, 'w') as fh_w:
    fh_w.write (f'#\n')
    fh_w.write (f'# synthetic data for fitting using ODR\n')
    fh_w.write (f'#\n')
    fh_w.write (f'#  format of this data file:\n')
    fh_w.write (f'#    1st column : x\n')
    fh_w.write (f'#    2nd column : x_err\n')
    fh_w.write (f'#    3rd column : y\n')
    fh_w.write (f'#    4th column : y_err\n')
    fh_w.write (f'#\n')
    for i in range (len (x)):
        fh_w.write (f'{x[i]:8.3f} {x_err[i]:8.3f} {y[i]:8.3f} {y_err[i]:8.3f}\n')
このプログラムを実行してみるでござる。
% python3.13 test_scipy_odr_00.py
% head -20 test_scipy_odr_00.data
#
# synthetic data for fitting using ODR
#
#  format of this data file:
#    1st column : x
#    2nd column : x_err
#    3rd column : y
#    4th column : y_err
#
  -9.583    0.678  -58.732    1.111
  -8.621    0.834  -50.153    1.067
  -7.650    0.720  -44.284    1.446
  -6.724    0.608  -35.783    2.054
  -5.439    0.934  -29.379    1.229
  -4.239    0.756  -21.663    1.192
  -3.256    0.227  -15.995    0.970
  -2.764    0.645   -8.958    2.057
  -1.942    0.267   -0.448    1.913
  -0.455    0.381    5.920    1.717
   0.539    0.570   12.917    1.535
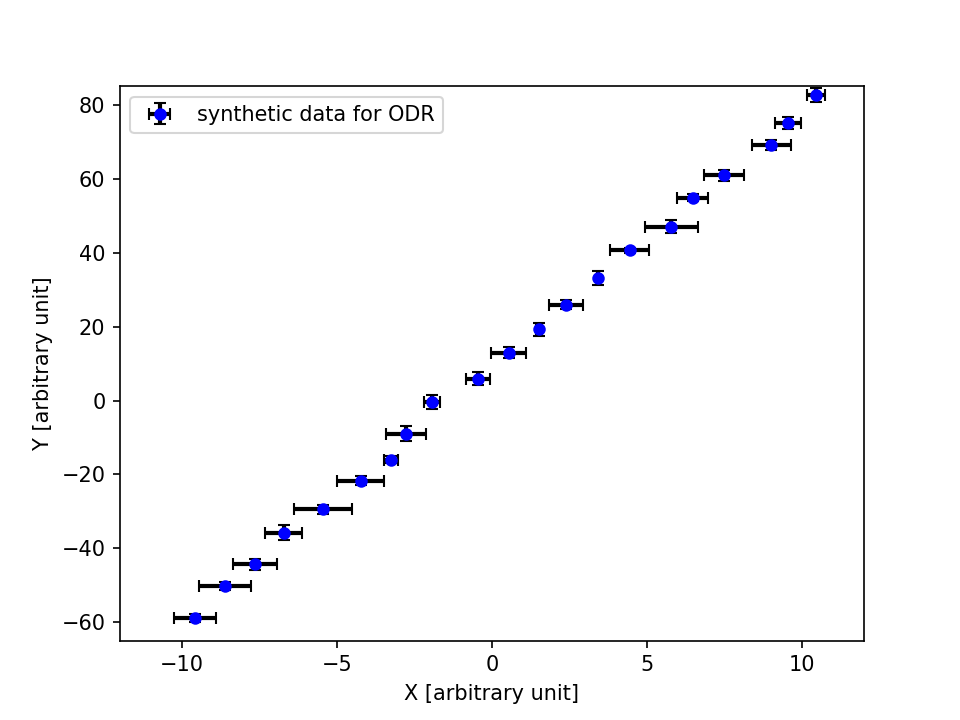
作ったデータを可視化してみるでござる。
#!/usr/pkg/bin/python3.13

#
# Time-stamp: <2025/03/16 13:12:07 (UT+08:00) daisuke>
#

# importing numpy module
import numpy

# importing matplotlib module
import matplotlib.backends.backend_agg
import matplotlib.figure

# input data file name
file_input = 'test_scipy_odr_00.data'

# output image file name
file_output = 'test_scipy_odr_01.png'

# resolution in DPI
resolution_dpi = 150

# making empty lists for storing data
list_x     = []
list_x_err = []
list_y     = []
list_y_err = []

# opening data file for reading
with open (file_input, 'r') as fh_r:
    # reading file line-by-line
    for line in fh_r:
        # skip if the line starts with '#'
        if (line[0] == '#'):
            continue
        # splitting data
        (x_str, x_err_str, y_str, y_err_str) = line.split ()
        # converting string into float
        x     = float (x_str)
        x_err = float (x_err_str)
        y     = float (y_str)
        y_err = float (y_err_str)
        # appending data to the end of lists
        list_x.append (x)
        list_x_err.append (x_err)
        list_y.append (y)
        list_y_err.append (y_err)

# making numpy arrays
array_x    = numpy.array (list_x)
array_xerr = numpy.array (list_x_err)
array_y    = numpy.array (list_y)
array_yerr = numpy.array (list_y_err)

# making a fig object using object-oriented interface
fig = matplotlib.figure.Figure ()

# making a canvas object
canvas = matplotlib.backends.backend_agg.FigureCanvasAgg (fig)

# making an axes object
ax = fig.add_subplot (111)

# axes
ax.set_xlabel ('X [arbitrary unit]')
ax.set_ylabel ('Y [arbitrary unit]')
ax.set_xlim (-12.0, +12.0)
ax.set_ylim (-65.0, +85.0)

# plotting data
ax.errorbar (array_x, array_y, xerr=array_xerr, yerr=array_yerr, \
             linestyle='None', marker='o', markersize=5, color='blue', \
             ecolor='black', elinewidth=2, capsize=3, \
             label='synthetic data for ODR')

# legend
ax.legend ()

# saving plot into file
fig.savefig (file_output, dpi=resolution_dpi)
実行してみるでござる。
% python3.13 test_scipy_odr_01.py
% ls -lF *.png
-rw-r--r--  1 daisuke  taiwan  34277 Mar 16 13:12 test_scipy_odr_01.png
% feh -dF test_scipy_odr_01.png

|
|---|
scipy.odr を使ってフィッティングを行ってみるでござる。
#!/usr/pkg/bin/python3.13

#
# Time-stamp: <2025/03/16 13:12:16 (UT+08:00) daisuke>
#

# importing numpy module
import numpy

# importing scipy module
import scipy

# input data file name
file_input = 'test_scipy_odr_00.data'

# making empty lists for storing data
list_x     = []
list_x_err = []
list_y     = []
list_y_err = []

# opening data file for reading
with open (file_input, 'r') as fh_r:
    # reading file line-by-line
    for line in fh_r:
        # skip if the line starts with '#'
        if (line[0] == '#'):
            continue
        # splitting data
        (x_str, x_err_str, y_str, y_err_str) = line.split ()
        # converting string into float
        x     = float (x_str)
        x_err = float (x_err_str)
        y     = float (y_str)
        y_err = float (y_err_str)
        # appending data to the end of lists
        list_x.append (x)
        list_x_err.append (x_err)
        list_y.append (y)
        list_y_err.append (y_err)

# making numpy arrays
array_x    = numpy.array (list_x)
array_xerr = numpy.array (list_x_err)
array_y    = numpy.array (list_y)
array_yerr = numpy.array (list_y_err)

#
# fitting using ODR
#

# initial guess of coefficients
initial_guess = [1.0, 1.0]

# function for fitting
def func (coeff, x):
    y = coeff[0] * x + coeff[1]
    return (y)

# making a model for ODR
odr_model = scipy.odr.Model (func)

# making data for ODR
odr_data = scipy.odr.Data (array_x, array_y, \
                           wd=1.0/(array_xerr**2), we=1.0/(array_yerr**2))

# making ODR object for fitting
odr_fitting = scipy.odr.ODR (odr_data, odr_model, beta0=initial_guess)

# carrying out ODR fitting
odr_result = odr_fitting.run ()

# printing result of ODR fitting
print (odr_result.pprint ())

# printing fitted coefficients and their errors
print (f'')
print (f'fitted coefficients')
print (f'  a = {odr_result.beta[0]:8.3f} +/- {odr_result.sd_beta[0]:8.3f}')
print (f'  b = {odr_result.beta[1]:8.3f} +/- {odr_result.sd_beta[1]:8.3f}')
実行結果は以下の通りでござる。
% python3.13 test_scipy_odr_02.py
Beta: [6.9908854 8.9742435]
Beta Std Error: [0.07232446 0.37805593]
Beta Covariance: [[ 0.02006738 -0.02606751]
 [-0.02606751  0.54831792]]
Residual Variance: 0.2606631741946989
Inverse Condition #: 0.20187026330190005
Reason(s) for Halting:
  Sum of squares convergence
None

fitted coefficients
  a =    6.991 +/-    0.072
  b =    8.974 +/-    0.378
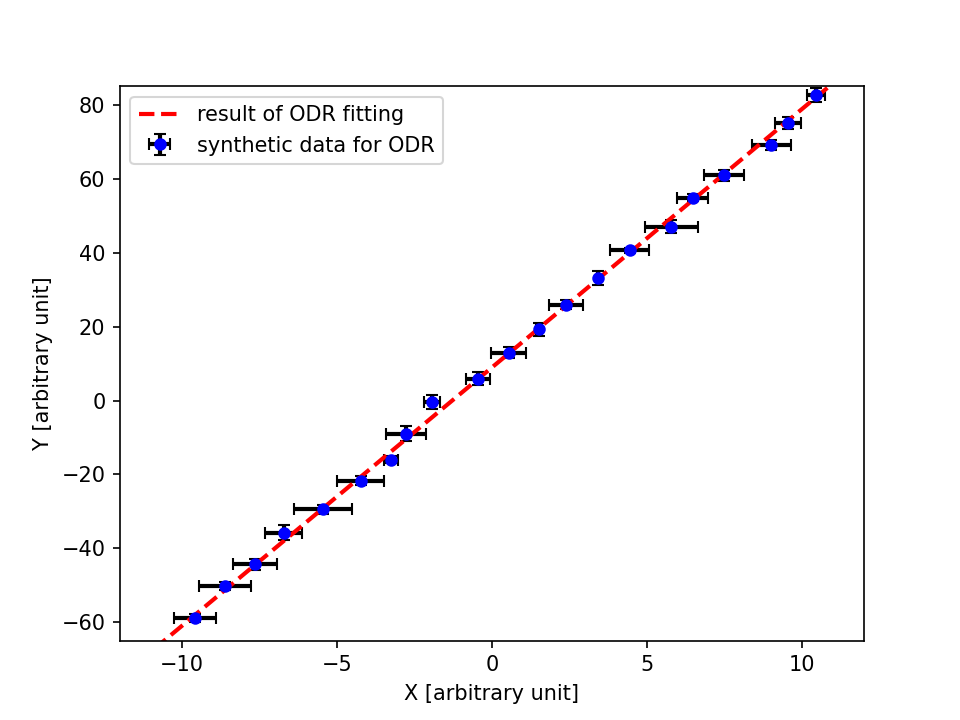
フィッティングの結果を可視化してみるでござる。
#!/usr/pkg/bin/python3.13

#
# Time-stamp: <2025/03/16 13:12:22 (UT+08:00) daisuke>
#

# importing numpy module
import numpy

# importing scipy module
import scipy

# importing matplotlib module
import matplotlib.backends.backend_agg
import matplotlib.figure

# input data file name
file_input = 'test_scipy_odr_00.data'

# output image file name
file_output = 'test_scipy_odr_03.png'

# resolution in DPI
resolution_dpi = 150

# parameters
x_min = -12.0
x_max = +12.0

# making empty lists for storing data
list_x     = []
list_x_err = []
list_y     = []
list_y_err = []

# opening data file for reading
with open (file_input, 'r') as fh_r:
    # reading file line-by-line
    for line in fh_r:
        # skip if the line starts with '#'
        if (line[0] == '#'):
            continue
        # splitting data
        (x_str, x_err_str, y_str, y_err_str) = line.split ()
        # converting string into float
        x     = float (x_str)
        x_err = float (x_err_str)
        y     = float (y_str)
        y_err = float (y_err_str)
        # appending data to the end of lists
        list_x.append (x)
        list_x_err.append (x_err)
        list_y.append (y)
        list_y_err.append (y_err)

# making numpy arrays
array_x    = numpy.array (list_x)
array_xerr = numpy.array (list_x_err)
array_y    = numpy.array (list_y)
array_yerr = numpy.array (list_y_err)

#
# fitting using ODR
#

# initial guess of coefficients
initial_guess = [1.0, 1.0]

# function for fitting
def func (coeff, x):
    y = coeff[0] * x + coeff[1]
    return (y)

# making a model for ODR
odr_model = scipy.odr.Model (func)

# making data for ODR
odr_data = scipy.odr.Data (array_x, array_y, \
                           wd=1.0/(array_xerr**2), we=1.0/(array_yerr**2))

# making ODR object for fitting
odr_fitting = scipy.odr.ODR (odr_data, odr_model, beta0=initial_guess)

# carrying out ODR fitting
odr_result = odr_fitting.run ()

# printing result of ODR fitting
print (odr_result.pprint ())

# printing fitted coefficients and their errors
print (f'')
print (f'fitted coefficients')
print (f'  a = {odr_result.beta[0]:8.3f} +/- {odr_result.sd_beta[0]:8.3f}')
print (f'  b = {odr_result.beta[1]:8.3f} +/- {odr_result.sd_beta[1]:8.3f}')

# making a fig object using object-oriented interface
fig = matplotlib.figure.Figure ()

# making a canvas object
canvas = matplotlib.backends.backend_agg.FigureCanvasAgg (fig)

# making an axes object
ax = fig.add_subplot (111)

# axes
ax.set_xlabel ('X [arbitrary unit]')
ax.set_ylabel ('Y [arbitrary unit]')
ax.set_xlim (-12.0, +12.0)
ax.set_ylim (-65.0, +85.0)

# plotting data
ax.errorbar (array_x, array_y, xerr=array_xerr, yerr=array_yerr, \
             linestyle='None', marker='o', markersize=5, color='blue', \
             ecolor='black', elinewidth=2, capsize=3, \
             label='synthetic data for ODR')

# plotting fitted line
array_x_fitted = numpy.linspace (x_min, x_max, 10000)
array_y_fitted = func ((odr_result.beta[0], odr_result.beta[1]), array_x_fitted)
ax.plot (array_x_fitted, array_y_fitted, \
         linestyle='--', linewidth=2, color='red', \
         label='result of ODR fitting')

# legend
ax.legend ()

# saving plot into file
fig.savefig (file_output, dpi=resolution_dpi)
実行してみた結果は、以下の通りでござる。
% python3.13 test_scipy_odr_03.py
Beta: [6.9908854 8.9742435]
Beta Std Error: [0.07232446 0.37805593]
Beta Covariance: [[ 0.02006738 -0.02606751]
 [-0.02606751  0.54831792]]
Residual Variance: 0.2606631741946989
Inverse Condition #: 0.20187026330190005
Reason(s) for Halting:
  Sum of squares convergence
None

fitted coefficients
  a =    6.991 +/-    0.072
  b =    8.974 +/-    0.378
% ls -lF *.png
-rw-r--r--  1 daisuke  taiwan  34277 Mar 16 13:12 test_scipy_odr_01.png
-rw-r--r--  1 daisuke  taiwan  45490 Mar 16 13:16 test_scipy_odr_03.png
% feh -dF test_scipy_odr_03.png

|
|---|